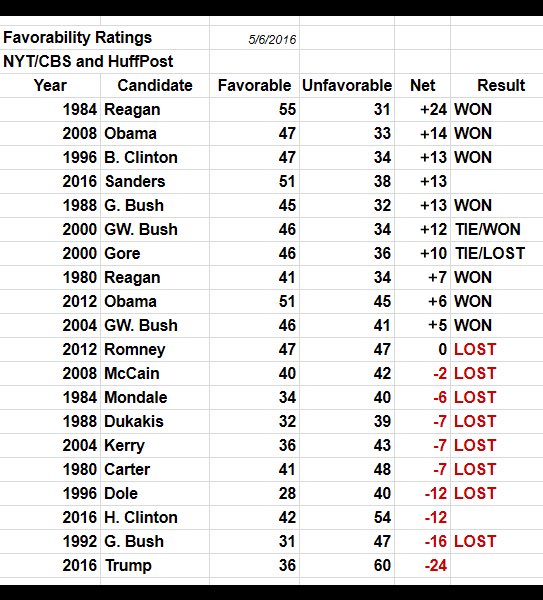
Recently, the above chart has been going around Twitter (with no link to sources, but a reference to NYT/CBS/Huffington Post polls). The argument is that Senator Bernie Sanders is supremely equipped by his favorability ratings to take on Donald Trump in a general election in November, and that Secretary Hillary Clinton is not. However, this chart omits two significant points of data. First of all, Bill Clinton’s favorability in 1992 is noticeably absent. Before taking the election in a landslide, in April, 1992, Bill Clinton’s ratings were 34 percent favorable and 47 percent unfavorable, giving him a net -13 (unfavorable), a point worse than his wife is currently running according to this chart.
A second missing factor is the differential between the winning candidates’ ratings and their opponents’ ratings (taking the winning candidate’s net +/- favorability, and subtracting from that their opponent’s net favorability). The differential between Sanders and Trump (37) is by far higher than any contests on this list (higher than the Reagan-Mondale contest differential, which is 30). That, of course, is the basic argument of the pro-Sanders user posting this chart; that Sanders ought to win a November general election against Trump in a landslide. However, the Hillary Clinton’s differential against Trump (12) is also higher than the lowest three differentials here: her husband’s victory in 1992 against incumbent President G.H.W. Bush (differential = 3); George W. Bush’s race in 2000 against Al Gore (differential = 2); and incumbent President Obama’s 2012 reelection win against challenger Mitt Romney (differential = 6). While there appears to be more risk in running Clinton against Trump than running Sanders as the Democratic nominee, a Clinton/Trump race, if decided on these favorability ratings, would be a Democratic win.
Headline image copied from a Tweet.
